March 6, 2020
A Case Study: What Kind of Facebook Content Drives the Most Website Traffic?
In the digital marketing world, some of the primary objectives of agencies are to create and maintain a client’s online presence, increase web traffic, and expand brand awareness. Meanwhile, from the client’s perspective, they want to see their business goals achieved with digital marketing as the catalyst. To be that catalyst, the agency must stop and take the time to check their work, mining through past data to find results to show that their work has positively impacted the client’s goals.
Recently, we crafted a case study from one of our retail clients to assess if the content we put out on Facebook proves to be statistically significant in increasing website traffic.
The Method
For this retailer, we publish four posts on Facebook each week, a higher than industry average number of posts. It is assumed that social media content linking back to the website should increase website traffic. But, we were curious to see which kinds of content we were sharing drove the most traffic and how to optimize our social content strategy. To analyze this, we broke down the content into four categories.
- Special offers
- Guides
- National holidays
- Organic posts
We randomly sampled twenty weeks from 2019 web traffic and determined whether a week was considered high or low traffic week. The median was 387 sessions, so any week with less than 387 sessions was labeled “low” and any week above 387 was labeled “high.” For each category, we recorded how many posts were shared for that specific week. Between the four categories, we found that the only category that had a significant impact on increasing website traffic was ‘special offers.’
The Statistics
To show whether or not a category was driving traffic, we ran a significance test. This means we compared the averages of two populations to see if there was a significant difference. Take category one, special offers, the two populations we created within this category were low traffic and high traffic.
Population One: Low Traffic
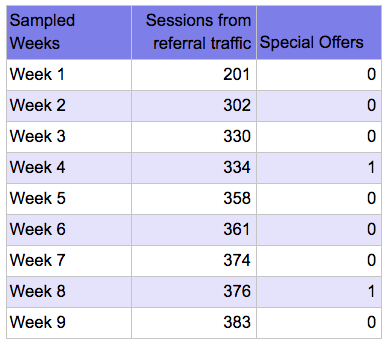
Population Two: High Traffic
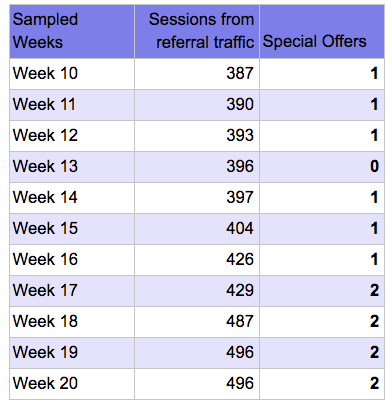
Can you see the trend? If not, recheck the special offers column in high traffic. Notice how the numbers are higher? In weeks when we had higher traffic to the website from social media, we also had a higher amount of special offers posts published to the client’s channels.
Now that we had identified a trend, we wanted to see if that slight increase was statistically significant.
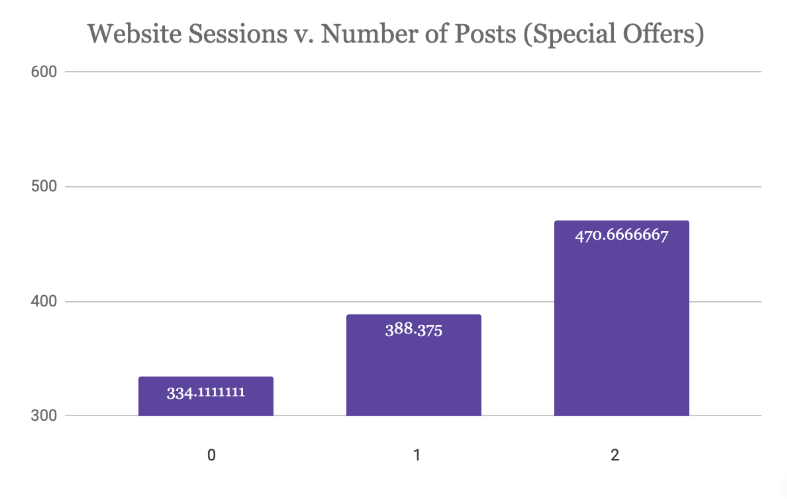
If you’ve ever taken a statistics class, you might remember the terms T-test and p-value. Don’t worry, we promise these aren’t as scary as they can sound. But, they are very important in proving significance in our findings. To test our data, we ran a one-sided T-test to determine if population one (low traffic weeks) had a higher average number of posts than population two (high traffic weeks). The assumption is that, if there are more posts in the high traffic population than low traffic, then the category being tested increases website traffic.
After running this test in our ‘special offers’ category, we got a p-value of 0.00062. A p-value, in simplistic terms, is the probability that the difference in the two population averages happened by chance with no influencing factors. Therefore, if a p-value is below 0.05, we can conclude that there is only a minimal chance these two population averages are different by random, so we reject that idea. This implies that an outside factor, in this case, high vs. low traffic weeks was influencing the average number of posts. We can conclude that when more ‘special offers’ posts were shared, website traffic increased. Additionally, we ran this same test on each category, but they all failed to be significant with p-values above 0.05.
Application
The main takeaway from this case study is the importance of connecting data with content and digital strategy. When it comes to something as simple as creating Facebook content, you might not think twice about the data behind it. However, with this new age of big data, taking the time to mine through the past can help make future decisions easier.
After this case study, we were able to create a more cohesive content strategy, one that we knew would align with our objective. The beauty of data is that you never know what it might show. We encourage you to think of a problem that you currently have and start looking through what your numbers say. It’s not as simple as exporting Google Analytics data and instantly seeing a solution. It will take time, creativity, and statistics to mine through the data, but it will help you make informed data-driven decisions in future marketing strategies in the long run.